SPEAK WITH A SPECIALIST
800-462-0071

I WANT TO

Gold: Solid Value, Liquid Asset

Close-up of stacked gold bar highlighted by warm reflections to convey gold’s liquidity, stability, and enduring value.
  • Gold continues to behave like a high-quality liquid asset, even without official recognition.
  • Institutional demand and potential reclassification could drive stronger demand and higher prices.
  • Physical gold can help protect your finances with both liquidity and long-term stability.

Liquidity When It Matters Most

When markets come under pressure, liquidity disappears fast. Buyers step back, spreads widen, and assets become difficult to move. Gold has often behaved differently, continuing to trade smoothly during stress.

Now, major players in the gold market are pushing to make that role official. The World Gold Council and London Bullion Market Association are working to have gold officially recognized as an asset banks can quickly convert into cash when fiscal pressure hits. Their case is built on how gold supports stability in the global financial system. For individual investors, that same set of qualities can play a very different role, helping protect access to value when conditions shift.1

What Banks Need in a Crisis

To understand why this matters, consider how banks prepare for stress. After the 2008 financial crisis, regulators introduced rules requiring banks to hold assets they could quickly convert into cash during stress. These assets are expected to be stable, widely accepted, and easy to sell even when markets are under pressure.

These assets are known as High Quality Liquid Assets, or HQLAs. They are designed to help banks meet short-term liquidity needs during periods of stress, including a 30-day window of potential outflows, a requirement often referred to as the Liquidity Coverage Ratio.

Cash and U.S. Treasuries sit at the top of that list. They are trusted, liquid, and deeply embedded in the global financial system. Gold is not officially included in that same category for liquidity requirements, but it shares many of the same characteristics.2

Gold Already Fits the Profile

Regulators define these assets by core characteristics. They are expected to carry low risk, be easy to value, trade in large markets, and maintain liquidity during stress. Gold aligns with each of these traits.

Gold trades in a global market that operates across time zones, with consistent demand from central banks, institutions, and private investors. Activity does not rely on a single exchange or a narrow group of buyers. When volatility rises, participation tends to increase rather than fade.

Liquidity is only part of the story. Gold has also shown a pattern of holding its value during periods when risk assets come under pressure. In market downturns, investors often shift toward assets they believe can preserve purchasing power. Gold has historically been one of those destinations. Not because of short-term price moves, but because it is not tied to the performance of a company, a currency, or a government balance sheet.

No Counterparty, No Dependency

Stocks depend on earnings. Bonds depend on issuers. Currencies depend on monetary policy. Gold stands apart from all three. It does not carry counterparty risk, and it does not rely on a promise to pay.

Recent years have provided clear examples. During the 2023 banking crisis, liquidity tightened across several parts of the financial system. Some assets became difficult to price and even harder to sell without taking losses. Gold continued to trade, rising more than 8% within a month. It provided a source of stability when liquidity mattered most.3

Despite this, gold is not currently included in bank liquidity buffers, even though it carries a 0% risk weight under capital rules. Under longer-term funding standards, it is often treated more like a commodity, which limits its formal role despite its real-world behavior.

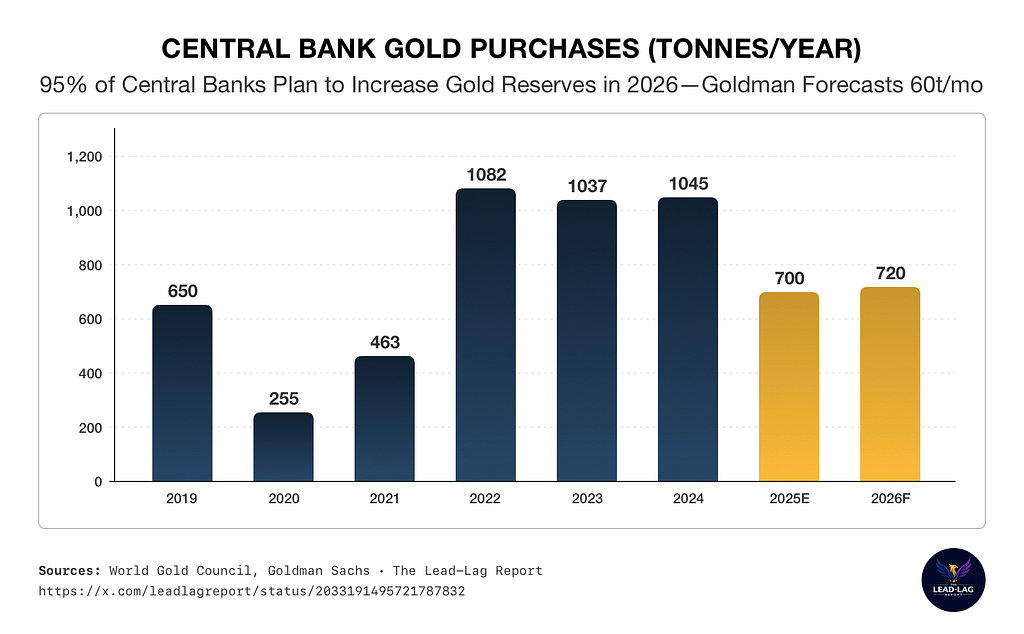
Why Central Banks Are Buying

Bar chart showing central bank gold purchases by year from 2019 to 2026 forecast, with buying surging above 1,000 tonnes in 2022, 2023, and 2024 and remaining elevated in 2025 and 2026 projections. Subtitle notes that 95% of central banks plan to increase gold reserves in 2026, with Goldman forecasting 60 tonnes per month.

4

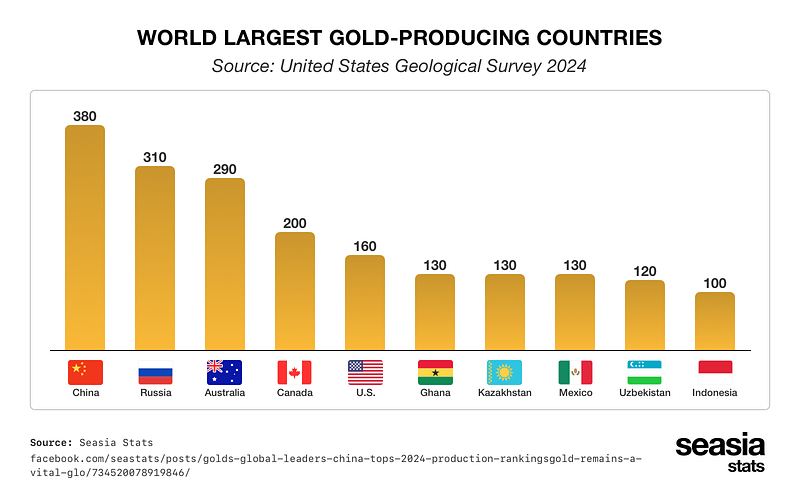
Central banks clearly recognize gold’s dual role. After several years of record buying, they continue adding to their reserves at levels well above historical averages. This sustained demand reflects a broader shift toward assets that operate outside traditional financial systems. Their consistent demand adds another layer to gold’s role, reinforcing its position as both a long-term store of value and a liquid asset.

What This Means for You

Markets do not always move in a straight line and liquidity can matter as much as returns. Assets that seem dependable during calm periods can behave very differently under pressure.

Gold has remained accessible across a wide range of environments. It trades globally and does not rely on a financial intermediary to hold its value. Many investors use gold to help balance a broader portfolio, particularly during uncertain periods.

Close-up of stacked gold bar highlighted by warm reflections to convey gold’s liquidity, stability, and enduring value.

The Bigger Shift Taking Shape

The discussion around High Quality Liquid Asset status highlights something important. Gold may not carry that formal label today, but its behavior continues to align with the qualities regulators look for. Stability, liquidity, and independence are not theoretical. They have been demonstrated in real market conditions.

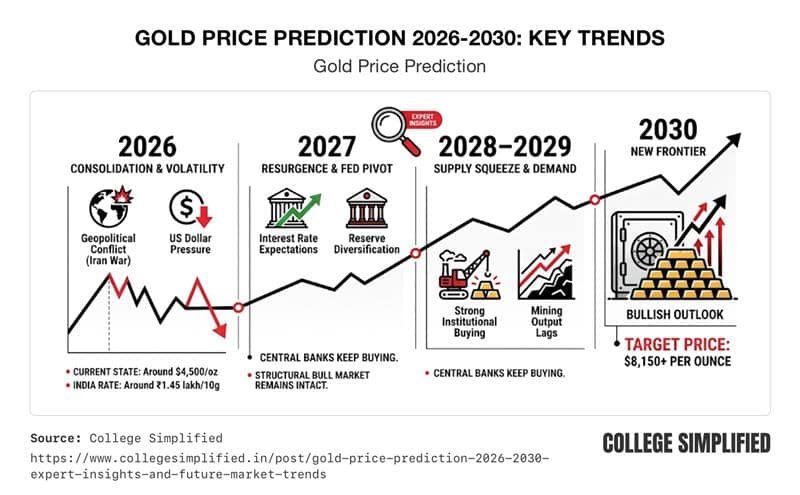
Some analysts believe that if gold is formally recognized in this way, it could increase central bank demand, tightening supply and putting additional upward pressure on prices.5

Conclusion

For those looking to diversify and protect long-term savings, physical gold remains a consideration. Whether held directly or within a Gold IRA, it offers a way to own a tangible asset not tied to traditional financial markets.

Economic conditions change. The need for stability and liquidity does not. To learn more about protecting your funds with precious metals, call American Hartford Gold today at 800-462-0071.

Notes:
1. https://hqla.gold/about
2. https://www.lbma.org.uk/articles/gold-as-a-level-1-high-quality-liquid-asset
3. https://www.reuters.com/markets/commodities/gold-poised-best-week-since-mid-nov-banking-sector-tension-2023-03-17/
4. https://www.instagram.com/p/DV6KT7IFnjn/
5. https://discoveryalert.com.au/gold-accumulation-2025-central-bank-strategies/

Rising Debt, Rising Risk

Rising Debt, Rising Risk

Rising Debt, Rising Risk

Debt Pressures Are Building

Federal Reserve Chair Jerome Powell offered a clear warning at Harvard this spring: America’s $39 trillion national debt is growing too fast for comfort. “The level of the debt is not unsustainable,” he said, “but the path is not sustainable. It will not end well if we don’t do something fairly soon.” The numbers back him up. Interest payments on the national debt are set to pass $1 trillion in 2026, nearly triple what the government paid in 2020.1

For now, the government can still meet its obligations. Powell reminded students that being the world’s reserve currency issuer gives the U.S. some breathing room. But he also made it clear that debt keeps climbing faster than overall growth. Projections from the Congressional Budget Office show debt held by the public rising from 101% of GDP today to about 120% by 2036, surpassing the post‑World War II record. 2

Debt growing at this pace limits flexibility in the next crisis. It raises the risk of higher interest rates, weaker economic growth, and mounting pressure on households, businesses, and retirement portfolios alike.

A defense buildup with a higher price tag

The next federal budget could strain those numbers even more. The White House is preparing a fiscal year 2027 request that includes a record $1.5 trillion in defense spending. Budget analysts call it the largest single‑year increase since World War II. The Committee for a Responsible Federal Budget (CRFB) estimates that the buildup would raise total defense spending by $5.8 trillion through 2036 and add $6.9 trillion to the national debt once interest is included.3

1.5T Defense Budget Adds Up

4

The motive behind the proposal is to rebuild U.S. strength and deter new conflicts. Yet fiscal watchdogs warn that another spending surge could make existing pressures worse. Elon Musk points out that interest costs already top the Defense Department’s annual budget. “If you look at our national debt, which is insanely high, the interest payments exceed the Defense Department budget—and they keep rising,” he said last year. “If AI and robots don’t solve our national debt, we’re toast.”5

The government is digging its own hole. It hopes to fix the fact that interest payments exceed defense spending by borrowing even more. Inflation, high rates, and the cost of servicing that debt mean the margin for error is shrinking. Every new dollar the Treasury issues adds to the weight Powell described as “unsustainable.”

Debt isn’t just a government problem

Rising debt is now hitting American households too. Data from Epiq AACER and the American Bankruptcy Institute show bankruptcy filings up 14% year over year in early 2026. Total household debt has grown to about $18.8 trillion, while delinquency rates on mortgages, credit cards, and student loans are all rising.6

A national survey by JG Wentworth found most Americans live just a few paychecks away from financial trouble. It takes only $6,356 in new debt, on average, to push a household toward bankruptcy. Participants cited cost‑of‑living pressures and higher tariffs as the main causes, not reckless spending. These findings show how thin the safety margin has become for the middle class in 2026.7

The wider fallout of a debt‑driven economy

The combination of record national debt and widespread personal debt creates a fragile economic foundation. Heavy borrowing can mask weakness for a time, but it eventually crowds out growth. When interest costs consume more of the budget, less remains for investment, research, or social support. Companies tighten their hiring and consumers cut back, slowing the entire cycle.

If the government piles on another $7 trillion for defense while households fight to stay current on bills, the strain could spread through every layer of the economy. Markets may hold up until confidence breaks, then move sharply as investors adjust to slower growth and higher costs. Past cycles show that deep debt burdens often lead to recessions, and recessions can hit stock portfolios hardest. As returns flatten, inflation eats away what remains.

Conclusion

Powell’s warning is technically about fiscal policy, not personal finance. But the message reaches everyone. A system built on rising rates, higher prices, and ballooning balances cannot keep that pace forever. The Federal Reserve can help with conditions, but it cannot erase the debt itself. Congress must act to restore balance, yet political appetite for cuts or tax hikes remains low.

When debt limits start to bite, the dollar weakens, and traditional investments become more volatile. In periods like this, gold has often served as a hedge. It’s an asset that holds value when currencies and equities lose their footing. America’s debt problem will take years to resolve, and the road there will test every market. To learn how a Gold IRA can protect savings from the fallout of a country spending beyond its means, call American Hartford Gold today at 800-462-0071.

Notes
1. https://fortune.com/2026/03/30/jerome-powell-39-trillion-national-debt-not-unsustainable-will-not-end-well/
2. https://fortune.com/2026/03/30/jerome-powell-39-trillion-national-debt-not-unsustainable-will-not-end-well/
3. https://fortune.com/2026/04/02/how-much-would-trump-military-budget-add-to-national-debt-39 trillion/?j=109720&jb=243&l=1227_HTML&sfmc_sub=15258701&u=8578558
4. https://finance.yahoo.com/economy/policy/articles/trump-wants-add-nearly-7-202737074.html
5. https://fortune.com/2026/04/02/how-much-would-trump-military-budget-add-to-national-debt-39-trillion/?j=109720&jb=243&l=1227_HTML&sfmc_sub=15258701&u=8578558
6. https://www.newsweek.com/bankruptcies-surge-in-us-11786651
7. https://studyfinds.com/most-americans-months-away-from-financial-collapse-bankruptcy-survey/


The End of Petrodollar Stability?

The End of Petrodollar Stability?
  • The Iran conflict is exposing vulnerabilities in the petrodollar system that has supported the dollar for decades.
  • Shifts in global oil trade and rising U.S. debt are putting pressure on the dollar’s long-term dominance.
  • Protecting your finances with physical gold in a Gold IRA can help reduce exposure to currency and market instability.

Oil, the Dollar, and Your Retirement

As tensions in the Middle East heat up, most Americans are watching the headlines for one thing: how much will it cost me at the pump? But the story is about more than just oil prices. It’s about the global system that has kept the U.S. dollar strong for decades, and how a war in Iran could be cracking that system open.

The Secret Deal That Changed the World

In the 1970s, the United States made a quiet deal with Saudi Arabia and other Gulf states. The U.S. promised security and military support, and in return, those countries would price their oil in U.S. dollars and send much of their oil profits back into American investments like U.S. Treasury bonds. This became known as the “petrodollar” system. For many years, it was taken for granted that oil would be bought and sold in dollars, and that the Middle East would stay tied to Washington’s protection.

The Petrodollar System

1

The deal helped keep the dollar as the world’s main reserve currency. It meant countries all over the world needed to hold dollars just to buy oil. And then they often put those dollars into U.S. assets. With this backing, the U.S. could borrow more easily, and American families and businesses could keep using a strong dollar for trade and travel.

Cracks Form in the System

Pressure on the system is showing up in a place most Americans rarely think about: the Strait of Hormuz. The passage is only 21 miles wide at its narrowest point, yet more than 20 million barrels of oil move through it each day, about 20% of global consumption. Much of that supply heads to Asia, making the strait a critical link in the global energy trade.

Iran’s disruption of that route did more than slow shipments. It exposed how much of the system depends on a single chokepoint and how much rests on U.S. protection in the region.

Gulf nations have built their economic model around the dollar. Saudi Arabia, the United Arab Emirates, Qatar, Oman, and Bahrain all peg their currencies to it, a system that requires roughly $800 billion in supporting reserves. Far larger still are the region’s sovereign wealth funds, with more than $6 trillion invested globally across bonds, stocks, private equity, and other U.S.-heavy assets. Recent attacks have started to shake confidence in that balance, leading some Gulf leaders to reconsider whether the security umbrella is still worth the cost.2

The Debt Problem at Home

At the same time, the U.S. is facing a crisis of its own. The national debt has crossed $39 trillion. Interest costs are projected to become the fastest‑growing part of the federal budget. The U.S. has already been downgraded by all three major credit‑rating agencies. The debt’s impact reaches beyond government finances and into the lives of families who rely on the dollar’s strength.3

The petrodollar system has long helped keep interest rates lower by giving the U.S. a built‑in market for its debt. When oil‑rich countries earn dollars from selling oil, they often put those dollars into U.S. Treasuries. Their steady demand has been a key reason the U.S. can borrow so much without the dollar crumbling. But if those same countries begin to lose faith in the U.S. security guarantee, they may start to look for other ways to protect their money.

The Gulf’s Moment of Doubt

Saudi Arabia now sells four times as much oil to China as it does to the U.S., and most Middle East oil flows to Asia. Some Gulf states have even begun experimenting with contracts that use currencies other than the dollar. There is now mention of the ‘petroyuan’.  The world may not switch away from the dollar overnight. But the long‑term shift could speed up in the shadows of this conflict.4

The End of Petrodollar Stability?

Conclusion

The stability of the petrodollar system is being tested in real time. If Gulf nations begin to question the U.S. security umbrella, capital flows could begin to move away from the dollar.

Shifts in the global system were already underway before the current conflict. The dollar’s share of global reserves has fallen to about 57%, down from 72% in 2001.

Loss of the petrodollar’s support would make it harder for the United States to borrow at low cost. Higher interest rates would move quickly through the economy, affecting mortgages, business loans, and everyday expenses.

The stakes go far beyond energy prices. The strength of the dollar, the stability of the U.S. economy, and the cost of living are all tied to the future of the petrodollar system. A weakening system would also mean less global influence, as reserve currency status has long been a cornerstone of American financial power.

Taking steps now to protect your retirement savings can help reduce exposure to those risks. Physical precious metals offer a way to hold assets outside of the financial system. They do not rely on currency policy, foreign demand for debt, or the stability of global trade agreements.

To learn how physical precious metals in a Gold IRA can help protect your portfolio, call American Hartford Gold today at 800-462-0071.

Notes:
1. https://www.reuters.com/markets/commodities/gulf-war-rattles-petrodollar-foundations-2026-03-25/
2. https://www.reuters.com/markets/commodities/gulf-war-rattles-petrodollar-foundations-2026-03-25/
3. https://fortune.com/2026/03/24/iran-hormuz-petrodollar-national-debt-trump/
4. https://www.reuters.com/markets/commodities/gulf-war-rattles-petrodollar-foundations-2026-03-25/

A New Global Gold Order Is Emerging

A New Global Gold Order Is Emerging

A New Global Gold Order Is Emerging

A Structural Shift is Underway

A single decree out of Moscow is sending shockwaves across gold trading desks from London to Dubai. Russia’s ban on exporting gold bars over 100 grams might sound like a niche regulation, but it’s proving to be one of the most consequential shifts in the modern era of precious metals.

Gold is being structurally reshaped in how it moves, who controls it, and what it represents. Beneath the apparent volatility lies a story of tightening supply, shifting alliances, and the return of gold as a true strategic asset.

What Just Changed in Gold Markets

Russia is responsible for roughly 10% of global gold production. But starting May 1, 2026, they will stop allowing any exports of gold bars weighing over 100 grams. The new rule effectively locks hundreds of tons of gold inside one of the world’s largest producers.1

World Largest Gold Producing Countries

2

Ahead of the deadline, Russian private holders are scrambling to move assets offshore. A temporary “April glut” is forming. Buyers in Turkey, the UAE, and Asia are seeing short-term supply spikes that look like falling prices. But this is a mirage. Once the ban takes effect, those flows will dry up overnight. And what follows is a genuine tightening of available supply.

Market participants would be wise to distinguish between the noise of short-term selling and the deeper message: gold is about to become significantly scarcer on the open market.

Supply Shock and the Scarcity Effect

By restricting large-scale exports, Russia is effectively removing 300+ tons of gold from international circulation. Basic economics takes over. When supply contracts and demand holds steady, prices climb. Already, gold futures are reflecting a “scarcity premium”. Future spot prices are being pushed toward the $4,800–$5,000 per ounce range.3

This moment highlights a critical fact: the availability of physical gold matters far more than paper valuations or futures positions. In times of constraint, traders and central banks care about who actually possesses the metal, not just who holds a claim to it.

The shift from paper to physical is reshaping how markets perceive value itself.

A Fragmenting Global Gold Market

For over a century, the London Bullion Market Association (LBMA) served as the global reference point for gold pricing. Now, its dominance is being tested. With Russia’s withdrawal from Western trading channels, a “two-tier” system is forming. One price set by Western markets where supply is constrained. And another among BRICS nations, where trade occurs through bilateral agreements and state-set exchange rates.4

These separate markets create inefficiencies and volatility. Prices can diverge widely as liquidity dries up in one region and persists in another. The result: higher transaction costs, wider bid-ask spreads, and a growing sense that the old, unified gold market is fracturing under political and economic pressure.

Central Banks and Global Demand

This tightening cycle is changing central bank behavior, the largest driver of gold prices. Nations such as China, India, and Saudi Arabia are visibly building reserves, driven by what some analysts call “defensive hoarding.” Their logic is simple: if gold is becoming harder to move and more politically restricted, the safest strategy is to own more of it domestically.5

Central bank purchases surpassed 860 tons in 2025, with BRICS members accounting for nearly 40% of that demand. This buying spree helps form a strong price floor, meaning that even if short-term volatility persists, long-term gold demand remains anchored.6

Gold’s Role Is Changing

Historically, gold served as a hedge against inflation and a reflection of investor sentiment toward interest rates. That era is ending. What’s emerging now is a model where gold functions as a strategic reserve asset. It is becoming a form of collateral in international trade and a shield against currency risk.

For example, the gold-backed BRICS Unit introduced last year ties 40% of its value to physical gold. It directly links the metal to global settlement systems. As governments begin treating gold less like a commodity and more like a reserve weapon, individual investors are recognizing that this reclassification fundamentally alters the market’s direction.It also hastens de-dollarization, and American dominance in the global economy.7

Conclusion

The events surrounding Russia’s export ban illustrate a turning point in how the world views and values gold. Supply is shrinking, pricing systems are fracturing, and global institutions are repositioning around physical reserves. The combination of which point to higher gold prices in the long term.

Volatility will likely remain. Yet instability often reinforces the case for tangible assets. While paper contracts can fluctuate with policy headlines, physical gold, and by extension, a Gold IRA, offers a form of protection grounded in scarcity and intrinsic value. The goal isn’t to speculate on day-to-day moves but to safeguard purchasing power through a period of structural change.

To learn more about protecting your retirement savings with physical gold or diversifying with a Gold IRA, call American Hartford Gold at 800‑462‑0071 today.

Notes:
1.https://english.news.cn/europe/20260326/b696bf6eb1244072a7ea11e2521165b1/c.htm
2. https://www.facebook.com/seastats/posts/golds-global-leaders-china-tops-2024-production-rankingsgold-remains-a-vital-glo/734520078919846/
3. https://www.reuters.com/business/finance/jp-morgan-expects-gold-prices-reach-6300oz-by-end-2026-2026-02-25/
4. https://www.reuters.com/world/europe/london-bullion-market-bars-russian-gold-refineries-2022-03-07/
5. https://www.reuters.com/world/india/central-banks-track-4th-year-massive-gold-purchases-metals-focus-says-2025-06-05/
6. https://news24online.com/world/russia-gold-export-ban-vladimir-putin-makes-big-move-amid-iran-war-crisis-bans-export-of-gold-bullion-to-are-russia-and-china-using-west-asia-war-to-dethrone-us-dollar-impact-for-india-is-de-dollariza/784860/amp
7. https://news24online.com/world/russia-gold-export-ban-vladimir-putin-makes-big-move-amid-iran-war-crisis-bans-export-of-gold-bullion-to-are-russia-and-china-using-west-asia-war-to-dethrone-us-dollar-impact-for-india-is-de-dollariza/784860/amp


Gold vs the Dollar: One Holds Value—One Loses It

Gold vs the Dollar: One Holds Value—One Loses It
  • Physical gold protects purchasing power as dollar value declines
  • Physical precious metals have intrinsic wealth with no counterparty risk
  • A tax-advantaged Gold IRA allows you to tailor a metals portfolio to meet your goals

Hold Value, Not Paper

Investors often ask a simple question when considering precious metals: do you actually receive real gold and silver?

At American Hartford Gold, the answer is yes. Clients own physical, tangible metals that can be delivered directly to their home or held in a Gold IRA in a private depository under their name.

During a recent discussion, American Hartford Gold’s Senior Director Machi Block explained that owning precious metals is not about abstract exposure. It is about direct control of real assets that can serve different financial goals, time horizons, and liquidity needs.

With a wide variety of available products, from Gold American Eagles to bars and proof sets, portfolios can be tailored to meet individual objectives while maintaining diversification.

The Purchasing Power Problem

The case for physical gold becomes clearer when viewed through the lens of purchasing power.

A kilo bar of gold cost roughly $32,000 in 2008. As gold prices rose over time, that same bar required about $50,000 in 2019 and more than $64,000 in 2020. By 2025, the cost had climbed well above $100,000, and today it exceeds $160,000.

The gold itself has not changed. What has changed is the value of the dollar.

As inflation persists and currency purchasing power declines, it takes more dollars to buy the same tangible asset. This long-term trend highlights a core concern for many investors: the gradual erosion of savings held in paper assets.

Why Physical Ownership Matters

Block emphasized that how you own gold is just as important as owning it.

Physical metals held in a private depository are stored in your name, with no competing claims. Investors maintain direct ownership and can access their holdings when needed.

Unlike paper assets, physical gold and silver do not rely on financial institutions, corporate performance, or third-party promises. They exist outside the traditional financial system, offering a level of independence that many Americans value during uncertain periods.

For those seeking long-term tax advantages through a Gold IRA, metals securely stored in a depository can still provide the same underlying ownership benefits.

Gold vs the Dollar: One Holds Value—One Loses It


A Wide Range of Options

Precious metals ownership is not limited to a single product. A variety of coins and bars are available in multiple sizes to provide additional portfolio flexibility. Proof sets are also available for investors seeking more specialized options.

Each product category can fulfill a different purpose, whether focused on liquidity, accumulation, or long-term wealth preservation. Working with experienced account executives allows you to build a portfolio that aligns with your specific financial situation and goals.

The Bigger Question

As the value of the dollar continues to face pressure from inflation and rising debt, Americans are left with a critical decision. Should wealth remain tied to paper assets that can lose purchasing power over time, or be allocated to tangible assets that have historically preserved value?

Gold and silver have long served as a hedge against currency devaluation. Their role is not based on short-term price movements, but on their ability to maintain purchasing power across economic cycles.

Conclusion

Physical precious metals offer a straightforward proposition: real assets, direct ownership, and long-term purchasing power protection. As economic uncertainty persists, more Americans are looking beyond traditional paper assets and toward tangible stores of value.

The question is not just how markets will perform in the short term. It is how well your wealth will hold up over time. Call American Hartford Gold at 800-462-0071 to learn how physical gold and silver, including within a Gold IRA, can help protect and strengthen your financial future.


Stagflation Risks Are Rising

Stagflation

  • Rising inflation and slowing growth are increasing the risk of stagflation
  • Higher energy costs are driving prices up while weakening economic momentum
  • A Gold IRA can help protect your finances from the impact of stagflation

Pressure Builds Across Economy

Higher prices alone are tough. Slower growth can be managed. But when both arrive together, the outcome is much more serious. Paychecks stretch less, savings lose value, and investment returns become harder to predict. Suddenly, retirement plans built on steady expectations look much less secure.

Economists have a word for this: stagflation, when rising inflation combines with weak economic growth. Recent developments suggest that this risk is moving from theory to reality. Conflict in the Middle East has driven oil prices higher, and those increases are spreading through the global economy.1

Concerns have risen quickly. Some economists now warn the United States faces a “quite high” risk of stagflation as energy costs climb while growth slows. Nobel Prize–winning economist Joseph Stiglitz said the U.S. was “the country most at risk” of entering stagflation, similar to what happened during the oil shocks of the 1970s.2

Even before recent events, signs of strain were building across the economy. New data showed consumer prices in February rose 3.5% year-over-year, while economic growth slowed to just 1.2% in the last quarter of 2025.3

Oil Shock Changes Outlook

Energy sits at the center of this shift. The Strait of Hormuz, a narrow waterway between Iran and Oman, carries roughly 20% of the world’s crude oil supply. Any disruption can send prices sharply higher.

Since the latest escalation in conflict, oil prices have surged more than 45%, reaching over $120 per barrel.4 Higher fuel costs raise transportation, manufacturing, and shipping prices. Businesses facing those new expenses often pass them along, driving inflation into everyday goods.

Energy-driven inflation rarely stays contained. Rising fuel prices increase fertilizer and food costs, which then boost grocery prices months later. Each stage adds another layer of pressure on households and businesses.

Growth Starts to Stall

Even as prices rise, the economy is slowing. Goldman Sachs recently put the chance of a U.S. recession within the next 12 months at 30%, up from 20% earlier this year.5

Businesses hesitate to invest when costs and demand are uncertain. Households react the same way. When essentials like gas and food get more expensive, discretionary spending drops. The University of Michigan’s Consumer Sentiment Index fell to 65.4 in March, its lowest reading since 2023.6

When consumers spend less, business revenue slows, creating a feedback loop that weakens economic momentum.

Fed Caught in the Middle

The Fed's Stagflation Squeeze

7

The Federal Reserve now faces a tough balancing act. Interest rates sit between 3.50% and 3.75% after a series of cuts last year aimed at softening the slowdown. Lowering rates further could boost growth but risks fueling more inflation. Raising them again could cool prices but also risk tipping the economy into recession.

Economists call this a supply-driven shock: energy and cost pressures push inflation higher while slowing production and demand. How long this lasts will determine whether stagflation takes hold.

Echoes of the Past

Rising oil prices and slowing growth have sparked comparisons to the 1970s. Back then, the U.S. saw a blend of high inflation and weak economic output. Between 1973 and 1982, inflation averaged 8.7% per year, while GDP growth slowed to below 2.5%.8

One key difference today: the U.S. produces far more of its own energy. Domestic oil output reached 13.5 million barrels per day in early 2026, an all-time high. 9 That helps cushion, but not eliminate, the effects of global price spikes on U.S. consumers.

Stagflation Risks Are Rising

Not All Assets React the Same

Traditional assets often struggle during stagflation. Stocks face profit pressure from slower growth, and bonds can lose value as inflation rises. But some assets have historically fared better. Commodities and precious metals, for example, tend to hold or even gain value during inflationary stretches.

Gold, in particular, has a reputation as a hedge. Its value doesn’t depend on interest rates or corporate earnings, so it often acts as a store of wealth when purchasing power declines. During the last inflation wave in the late 1970s, gold prices rose from around $185 an ounce in 1974 to over $600 by 1980.10

Conclusion

Rising energy costs, slower growth, and persistent inflation together raise the risk of stagflation, a mix that can erode savings and challenge retirement strategies. Historically, many investors have turned to physical gold to protect their portfolios during these uncertain times.

For those looking to preserve long-term value, adding physical precious metals to a tax advantaged Gold IRA remains a well-known safeguard.

To learn how to include gold in a retirement strategy, call American Hartford Gold at 800-462-0071 today.


Notes
1. Reuters, March 2026
2. The Guardian, Feb 2026
3. U.S. Bureau of Economic Analysis
4. Bloomberg, March 2026
5. Goldman Sachs Macro Outlook, March 2026
6. University of Michigan Surveys of Consumers
7. Jame Slavish.
8. Federal Reserve History
9. U.S. EIA, March 2026
10. World Gold Council


Gold’s Short-Term Swings, Long Term Strength

Gold’s Short-Term Swings, Long Term Strength

Gold’s Short-Term Swings, Long Term Strength

Gold’s Long Term Outlook Holds

Gold’s path has been anything but smooth lately. Sharp swings are grabbing attention, but the bigger picture has not changed. Gold’s long-term case remains intact, and for those focused on protecting wealth, it continues to play a steady role beyond short term price moves.

After reaching record highs above $5,500 to $5,600 earlier this year, gold turned lower. It broke below key support around $4,960, a price level where buyers had consistently stepped in to hold prices up. Prices also fell below the 50-day moving average, a level closely monitored by many short-term traders. Once that level broke, it signaled potential weakness and drew in more selling.1,2

On March 23, U.S. futures briefly dropped into the low 4,100s. Spot prices fell to about $4,097 before recovering, a reminder of how quickly sentiment can shift in this market. Even with that rebound, gold had already declined for multiple sessions and was coming off one of its weakest short term stretches in decades.3,4

A Sudden Reversal Shows How Fast Markets Can Shift

The same day gold hit those lows, the market turned sharply higher. Prices rebounded after President Donald Trump announced that the United States would postpone planned military strikes on Iranian infrastructure and continue negotiations.5

The shift in tone had an immediate impact across markets. Oil prices dropped, the dollar moved lower, and gold bounced off its intraday lows. A weaker dollar tends to support gold by making it more affordable to global buyers.

The move highlights how sensitive gold can be to geopolitical headlines. Markets had been pricing in escalation, then quickly adjusted when the outlook changed. Volatility like this is likely to continue as new developments unfold.

Short Term Pressure Is Still Real

Even with that rebound, gold remains under pressure in the near term. A stronger dollar leading into the selloff, along with expectations that interest rates may stay higher for longer, has weighed on prices.

Higher energy prices tied to conflict have also pushed inflation expectations higher. Real yields, which reflect interest rates after adjusting for inflation, have moved higher as a result. When investors expect inflation to stay elevated, interest rates often rise as well, pushing real yields up. Higher real yields can reduce the appeal of holding gold since it does not produce income.

Forced liquidations have added to the pressure. When investors need liquidity, gold is often sold alongside other assets. Pullbacks like this tend to be driven more by positioning and liquidity than a change in the long-term story.

Geopolitics Is Pulling Gold in Both Directions

Global tensions continue to influence gold, but not always in a predictable way. The risk of conflict in the Middle East has driven safe haven demand at times, helping push prices higher earlier this year.6

At the same time, those same tensions have contributed to rising energy prices and inflation expectations. Together, they support higher rates and a stronger dollar, both of which can weigh on gold.

Recent price action reflects that push and pull. Gold can rise on fear, then fall as rate expectations shift. Many analysts describe the current setup as structurally bullish, tactically nervous.7

The Long-Term Outlook Remains Intact

Gold Price Prediction

Even with short term pressure and the risk of further downside if gold does not reclaim the $4,900 to $5,000 support range, the longer term outlook remains intact. Many large institutions and bullion banks continue to project higher prices over time. Forecasts range between $5,000 and $6,200 and some scenarios reaching $6,500 to $8,000.9

Gold remains supported by ongoing geopolitical risk, continued central bank buying, and the potential for policy easing later in the cycle. Even after the recent decline, gold is still operating within a broader trend that has been building over time. Pullbacks, even sharp ones, are part of that process.

Conclusion

Gold’s recent pullback shows how rapidly markets can move, but it also highlights the importance of looking beyond short-term swings. Price moves driven by headlines, interest rates, and liquidity can shift quickly, while the long-term drivers behind gold remain in place.

Investors who take a longer view tend to focus less on daily movement and more on overall direction. Gold has long been used to preserve wealth during uncertain times, and that role continues even in periods of volatility.

For those focused on protecting wealth over time, gold continues to offer a stable foundation. If you want to take steps toward long term protection, consider holding precious metals in a tax-advantaged Gold IRA. Learn more from American Hartford Gold by calling 800-462-0071 today.

Notes:
1. https://seekingalpha.com/news/4545889-golds-longer-term-investment-case-intact-despite-pullback-jp-morgan-says-with-view-to-6300
2. https://www.fxempire.com/forecasts/article/gold-analysis-highlights-pullback-risk-despite-long-term-bullish-trend
3. https://www.fxempire.com/forecasts/article/gold-analysis-highlights-pullback-risk-despite-long-term-bullish-trend
4. https://moneyfellows.com/en-us/3elmelgeib-home/the-role-of-gold-in-securing-your-financial-future
5. https://www.reuters.com/plus/the-case-for-gold-protect-and-build-your-wealth
6. https://www.reuters.com/plus/the-case-for-gold-protect-and-build-your-wealth
7. https://seekingalpha.com/news/4545889-golds-longer-term-investment-case-intact-despite-pullback-jp-morgan-says-with-view-to-6300
8. https://www.collegesimplified.in/post/gold-price-prediction-2026-2030-expert-insights-and-future-market-trends
9. https://seekingalpha.com/news/4545889-golds-longer-term-investment-case-intact-despite-pullback-jp-morgan-says-with-view-to-6300


Rates on Hold, Economy in Limbo

Rates on Hold, Economy in Limbo

  • The Fed is holding rates steady as inflation remains elevated and economic uncertainty continues to build.
  • Higher-for-longer interest rates are increasing pressure on consumers, businesses, and financial markets.
  • Physical gold offers a way to help protect your finances from inflation and ongoing economic uncertainty.

No Cuts Amid Growing Uncertainty

Interest rate decisions rarely stay confined to Wall Street. They impact nearly every facet of the economy, and the latest decision shows exactly how.

The Federal Reserve held interest rates steady at a target range of 3.50% to 3.75%. The decision reflects growing concern among policymakers over higher inflation forecasts and rising uncertainty tied to tensions in the Middle East. The decision signals rate cuts may be farther off than hoped.1

Moves like this shape borrowing costs, investment returns, and the value of your savings, making interest rates one of the most important forces in both the economy and your personal finances.

Federal Reserve Holds US Interest Rates

2

Inflation Keeps the Fed Cautious

The Fed’s decision comes as inflation remains above its 2% target. Officials now expect inflation to end the year at 2.7%, up from a previous 2.4% estimate. Core PCE inflation is also projected at 2.7%, higher than earlier forecasts. The increases reflect that price pressures are not easing as quickly as hoped. 3

At the same time, new risks are emerging. Ongoing conflict in the Middle East has pushed energy prices higher and added uncertainty to the global outlook, making the Fed less confident about lowering rates.4

Fewer Cuts Ahead

The Fed’s updated projections point to a slower path for rate cuts. Policymakers now expect only one quarter-point cut in 2026. One official even projected a rate hike next year due to the murky inflation outlook. Chair Jerome Powell has not yet given clear forward guidance.  Much may depend on how the economy responds to current conditions in the months ahead.5

Pressure Builds Across the Economy

With borrowing costs remaining elevated, higher interest rates will continue to impact both consumers and businesses. Mortgage rates, credit cards, and auto loans are still expensive. Despite some easing, they remain well above levels seen in the years after the financial crisis.

Businesses are also facing tighter financial conditions. As a result, hiring and investment may slow even as demand for loans continues. Job growth has also slowed, with unemployment projected to hold at 4.4%. In addition, more households are falling behind on payments as savings decline.6

The Fed is trying to bring inflation under control without tipping the economy into a downturn. Policymakers are projecting only a gradual path toward lower rates. The outlook has become more complicated as rising energy prices add pressure to both growth and inflation.

Rates on Hold, Economy in Limbo

Markets Adjust to the Outlook

Markets reacted quickly. The U.S. dollar climbed to a 10-month high against major currencies as investors adjusted to expectations for sustained elevated rates.7

A stronger dollar suggests U.S. interest rates may stay higher than those in other countries, drawing money into dollar assets. Higher rates tend to push money into safer investments like Treasuries and away from riskier assets like stocks, which can weigh on markets and increase borrowing costs.

Some analysts believe the Fed may still face surprises. Inflation could remain elevated longer than expected. Or new shocks may force policymakers to adjust their plans again. The outlook remains increasingly uncertain.

Investment Impact

The current environment presents a mix of challenges. Higher interest rates can slow economic growth and increase volatility in financial markets. Inflation continues to erode purchasing power. These pressures make it harder for traditional portfolios to perform as expected, especially when both stocks and bonds face strain instead of counterbalancing each other.

In uncertain conditions like these, many look for assets that can hold value over time. Gold has often served that role during periods of inflation and economic stress, particularly when real returns on other investments come under pressure.

Even with a stronger dollar in the short term, persistent inflation, geopolitical tension, and long-term fiscal concerns continue to support demand for physical gold. Unlike paper assets, physical gold does not rely on market performance or a third party. It has historically helped preserve purchasing power across economic cycles.

Conclusion

The Fed’s latest decision shows just how unstable the situation has become. Policymakers are holding rates steady while caught between stubborn inflation and a slowing economy, as the risk of stagflation hangs in the background. Rising global tensions and shifting economic signals are making the outlook harder to read by the day. With so many forces pulling in opposite directions, the Fed is left in a wait-and-see stance. No one can say which way the economy will turn next.

Even if the Fed is navigating uncertainty, you don’t have to leave your financial future exposed. For those seeking long-term protection from interest rate uncertainty, a Gold IRA can offer a way to help preserve purchasing power and bring stability to a retirement portfolio. To learn how precious metals in a Gold IRA can help you secure your financial goals, call American Hartford Gold today at 800-462-0071.

Notes
1. https://www.federalreserve.gov/monetarypolicy/fomcprojtabl20260318.htm
2. https://www.instagram.com/p/DWCZ5VBjEYX/
3. https://www.bls.gov/news.release/cpi.nr0.htm
4. https://www.eia.gov/outlooks/steo/
5. https://www.federalreserve.gov/monetarypolicy/fomcprojtabl20260318.htm#individual-projections
6. https://www.newyorkfed.org/microeconomics/hhdc.html
7. https://www.bloomberg.com/markets/currencies


Silver’s Volatile Climb Continues

Silver’s Volatile Climb Continues

Silver’s Volatile Climb Continues

Silver’s Volatility Explained

Silver has had a dramatic run over the past year. Prices surged rapidly, briefly reaching around $120 per ounce before pulling back sharply in recent weeks.

Silver is well known for its volatility, often producing powerful rallies followed by steep pullbacks. While the recent decline has unsettled some investors, many analysts say it does not necessarily signal the end of the broader trend. Despite the turbulence, analysts believe silver still has room to run and could remain a valuable component of a diversified portfolio.

A Major Break Above $50

Part of that view comes from the long-term structure of the silver market. For decades, silver struggled to break above $50. Silver tested that ceiling during rallies in 1980 and again in 2011 but failed to stay above it. When the metal finally broke through $50 in 2025, it signaled the start of a new cycle.

Over several decades, silver prices formed what analysts call a cup-and-handle pattern, a chart formation that often signals a long-term breakout and the start of a sustained upward trend.

1

The peaks in 1980 and 2011 formed the cup. Consolidation from 2011 through 2025 formed the handle. When silver broke out above $50 last year, the move triggered a powerful rally that eventually carried prices toward $120.

Technical indicators reached levels last seen during the 1980 silver spike. Many analysts believe the current pullback is simply the market cooling down after an unusually fast climb. They view $50–$60 as a key long-term support zone. As long as silver holds above those levels, the broader bullish structure remains in place.

The Economic Forces Behind Precious Metals

The economic backdrop may also support precious metals in the months ahead. One major factor is the surge in global energy prices. Brent crude oil has recently climbed above $100 per barrel. Historically, spikes in energy prices tend to push inflation higher across the economy. When inflation rises and currencies lose purchasing power, investors often turn to hard assets like gold and silver to help preserve value.

Higher inflation can complicate monetary policy. If price pressures stay elevated, the Federal Reserve may delay cutting interest rates. And higher borrowing costs can reduce short-term demand for precious metals.

However, the recent rally in silver occurred while interest rates were already high. Many economists still expect rate cuts later in the cycle. When those cuts eventually arrive, lower borrowing costs could provide another tailwind for precious metals.

Financial conditions have also been tightening. Measures such as the Chicago Fed’s National Financial Conditions Index show credit becoming more restrictive. While freight shipment data suggests economic activity may be slowing. When inflation risks rise as economic growth weakens, markets often enter a difficult environment. Precious metals have historically performed well during periods like this.2

Why Silver Can Move So Dramatically

Even with those pressures, many analysts believe the recent drop in silver reflects consolidation rather than a collapse in the market.

Silver is unique among precious metals because it serves both as a monetary metal and an industrial commodity. It is widely used in electronics, solar panels, and industry. That dual role often amplifies price movements, producing sharp rallies followed by equally sharp corrections.

At the same time, the supply side of the market has been tightening. The global silver market has recorded supply deficits for six consecutive years as industrial and investment demand continues to grow. That imbalance has helped create a price floor for the metal.3

Some analysts believe silver may now be building a base before its next major move higher.

Rashad Hajiyev, founder of RM Capital Consulting, said, “The global economic and geopolitical background is very bullish for precious metals. Once silver is done with consolidation, another even stronger leg up will follow.”4

Price targets vary widely, but several forecasts suggest silver could eventually reach $140 to $150 if the next upward phase develops.4

Conclusion

Silver’s recent pullback comes after an unusually fast rally. It now appears to represent another stage in a larger bull cycle that began when silver finally rocketed through the $50 ceiling. The metal’s long-term technical structure, ongoing supply deficits, and supportive economic conditions continue to point toward higher prices over time.

For many Americans, silver can continue to play an important role alongside gold in helping protect the value of retirement assets. If you want to learn more about securing your retirement portfolio with a Gold IRA, call American Hartford Gold at 800-462-0071 today to speak with a specialist.

Notes:
1. https://thebubblebubble.substack.com/p/why-its-still-early-for-silver
2. https://www.chicagofed.org/research/data/nfci/about
3. https://www.prnewswire.com/news-releases/silver-demand-hits-a-sixth-straight-deficit-the-supply-math-doesnt-add-up-302698677.html
4. https://watcher.guru/news/from-30-to-121-why-silvers-next-leg-could-shock-markets


Why It’s Not Too Late to Buy Gold

Why It’s Not Too Late to Buy Gold
  • Despite gold’s eight-month rise, long-term trends show there is still opportunity to purchase.
  • Rising government debt, global uncertainty, and central bank demand continue to drive gold prices.
  • Holding physical gold in a Gold IRA can protect your wealth and diversify your portfolio during economic uncertainty.

Gold’s Momentum and Wealth Protection

Like the old saying goes, the best time to do something was years ago, and the second-best time is now: the same goes for gold. Gold has surged for 8 straight months, a streak only matched once before, just before the 2008 financial crisis. 1 Prices have jumped about 75% over the past year, topping $5,000 per ounce in January. Many investors wonder if they’ve missed their chance, but analysts say no, the gold rally is driven by long-term trends, not short-term hype.2

What’s Driving Interest in Precious Metals

One of the biggest forces behind the rally is the growing level of government debt worldwide.

Why It’s Not Too Late to Buy Gold

3

In the United States, federal debt exceeds 120% of GDP, with annual deficits around 6–7% of GDP. Other major economies, including Japan, the U.K., France, and Canada, also have debt above 100% of GDP.

The IMF projects that total global public debt will top 100% of GDP by 2029, the highest level since 1948. Officials warn this could increase the risk of financial crises and stress the importance of fiscal buffers. The IMF’s Vitor Gaspar notes that debt could reach 123% of GDP by decade’s end, creating a dangerous “fiscal-financial doom loop” similar to Europe’s 2010 debt crisis.4

When debt climbs this high, investors often turn to assets governments cannot create at will. Borrowing more or printing money can weaken a currency and reduce its buying power. In these situations, gold has historically helped protect wealth.

Uncertainty is Driving Safe Haven Demand

War with Iran and chaotic trade policies are adding to uncertainty. Geopolitical and policy risks make investors nervous, as they can trigger sudden market swings and threaten portfolios. In times like these, gold acts as a safe haven, a limited and reliable store of value when confidence in currencies or markets wavers.

Gold’s safe-haven role is backed by history. Since 2020, in months when the S&P 500 fell more than 5%, gold still rose about 2% on average, while U.S. bonds stayed flat.5

Global demand trends suggest room for more investment. India and China together account for nearly 60% of consumer gold demand, while North America and Europe contribute only about 15%. This gap shows that Western investors may still be under allocated to gold.

Central Banks Continue Buying Gold

Demand is also strong from central banks, which hold about 20% of all mined gold and have steadily increased their reserves from 2022 to 2025. Much of this buying reflects de-dollarization. They are diversifying away from the U.S. dollar to protect against a weakening currency and to reduce reliance on Western financial influence.

In 2025, gold became the largest component of global reserves, surpassing U.S. Treasuries for the first time in about 30 years. Central banks often take a long-term view when building reserves: 95% expect global gold holdings to rise in 2026, up from 81% in 2024 and 52% in 2021.6

Why It’s Not Too Late to Buy Gold

Looking Ahead: Gold Price Predictions

Reflecting this strong demand, analysts are projecting higher gold prices. JP Morgan sees gold reaching $6,300 per ounce, Yardeni Research forecasts $6,000, Wells Fargo anticipates $6,100–$6,300, and AI model CoPilot sets an upper bound of $6,220. These projections suggest the current rally could continue even after recent gains.7

New Buyers Are Emerging in the Gold Market

The gold market is also seeing new types of buyers, partly due to stablecoins. These digital currencies are designed to maintain a stable value and are often backed by reserve assets, including gold. For example, Tether has accumulated roughly 140 tons of gold, placing it among the 33 largest gold holders in the world. Stablecoins have grown from about $28 billion in 2020 to over $280 billion in 2025. As these systems expand, they could introduce an entirely new class of gold investors.8

Conclusion

Despite recent ups and downs, many of the factors supporting gold remain intact: high government debt, global uncertainty, and central bank accumulation. The current bull market is ongoing rather than over. History shows that major trends in precious metals often unfold over years, giving investors time to consider adding gold for diversification and protection.

To learn more about how physical precious metals held in a tax-advantaged Gold IRA can protect your portfolio, call American Hartford Gold today at 800-462-0071.

Notes
1. https://finance.yahoo.com/news/gold-just-did-2nd-time-065000363.html
2. https://www.investing.com/news/commodities-news/gold-starts-2026-higher-after-60-surge-last-year-silver-platinum-follow-4427311
3. https://www.gold.org/goldhub/data/gold-prices
4. https://www.bloomberg.com/news/articles/2025-10-15/global-public-debt-set-to-top-post-wwii-levels-by-2029-imf-says
5. https://www.kitco.com/news/article/2026-03-10/blackrock-sees-further-gains-both-gold-and-silver
6. https://think.ing.com/articles/golds-bull-run-to-continue-in-2026/
7. https://www.reuters.com/business/jp-morgan-sees-year-end-2026-gold-price-6300-per-ounce-2026-02-25/
8. https://thedeepdive.ca/tether-buys-27-tons-of-gold-rivaling-central-banks-in-q4/


Market Turmoil Follows Oil Price Surge

Market Turmoil Follows Oil Price Surge

Market Turmoil Follows Oil Price Surge

Global Energy Shock Hits Markets Hard

Oil markets erupted on March 9, 2026, as the escalating war between the United States, Israel, and Iran sent crude prices surging. The sudden spike threatened higher prices, tighter budgets, and market volatility, rattling the global economy and potentially your portfolio.

Within days of the conflict expanding, crude prices surged nearly 20 percent. Brent crude jumped above 100 dollars per barrel and briefly approached 120 dollars, marking some of the strongest intraday gains in years.1

The surge came as fears grew that the conflict could disrupt one of the most critical energy corridors in the world, the Strait of Hormuz. The narrow waterway normally carries about 20 percent of the world’s oil and liquefied natural gas shipments. With shipping severely reduced, markets quickly priced in the risk of prolonged global oil and gas shortages.

Oil had already been trending higher before the escalation. But the widening war quickly changed expectations about global supply. Energy analysts warn that continued hostilities and attacks on ships near the Strait could further slow or even temporarily halt exports from Iran and other major Middle Eastern producers.

Energy shocks like this rarely stay confined to the oil market. They can impact inflation, economic growth, and other financial markets around the world.

Oil Shocks Spread

Oil sits at the center of the global economy. Analysts have warned that rising oil prices could push transportation, manufacturing, and food costs higher worldwide. When prices rise rapidly, businesses face higher operating costs while consumers pay more for fuel and everyday goods.

Crude Oil Rises

2

The latest shock has not been limited to crude oil alone. European natural gas futures surged as much as 30 percent during the same trading session. Broader energy costs are set to rise across multiple sectors.

Financial markets have already reacted to the surge. Stock futures dropped sharply as crude prices climbed. Dow futures fell more than 1,000 points. European markets also opened sharply lower as traders priced in the economic risks of an expanding Middle East conflict.

Governments around the world are already scrambling to contain the economic damage. Some countries are exploring fuel subsidies, tax cuts, and other emergency measures aimed at softening the blow for households and businesses as energy prices surge.

Rising fuel prices can push inflation higher while slowing economic activity. Together, they create one of the most feared and stubborn economic challenges: stagflation.

Stagflation Concerns Are Returning

Energy shocks have historically been one of the primary triggers of stagflation. As oil prices climb, businesses face higher costs and consumers reduce spending elsewhere. The result can be slower growth paired with persistent inflation.

History offers an important comparison.

During the 1970s, oil supply disruptions and geopolitical tensions helped trigger one of the most difficult stagflation periods in modern history. Crude oil prices roughly quadrupled after the 1973 embargo. U.S. inflation peaked near 13% by 1980. Growth slowed and financial markets struggled through years of instability.3

Portfolios Pressures

This environment can be especially challenging for retirement accounts. They are often concentrated in equities and heavily weighted toward stock funds that thrive only during steady economic growth.

During conflicts like today’s that pressure oil markets, rising costs eat into corporate profit margins. At the same time, tighter household budgets curb consumer spending, creating a negative cycle that fuels stagflation. Volatility across equity markets is the usual result as investors reassess growth prospects and adjust portfolios. The pattern revealed itself as stocks tumbled alongside the recent oil surge.

For retirement savers, moments like this raise important questions about diversification.

Gold During Economic Shocks

Periods of geopolitical conflict and economic uncertainty often lead investors to reconsider how their savings are protected.

During the stagflation of the 1970’s, gold experienced one of the most dramatic bull markets on record. After the Bretton Woods monetary system ended in 1971, gold traded near $35 per ounce. By January 1980, the price had reached roughly $850 per ounce as investors hedged against soaring inflation. That move represented a gain of about 2,300 percent in less than a decade.4

Unlike stocks and bonds, gold does not depend on corporate earnings or economic growth. Because it is a physical asset that cannot be created by governments or central banks, it has historically been viewed as a store of value during inflation, financial instability, and global turmoil.

Conclusion

The sudden surge in oil prices during the latest Middle East conflict highlights how quickly economic conditions can change. Energy shocks can spread through markets, influence inflation, and create new risks for retirement savings.

To protect your retirement funds, consider putting precious metals in a Gold IRA. Learn more by calling American Hartford Gold at 800-462-0071 today.

Notes
1. https://www.argusmedia.com/zh/news-and-insights/latest-market-news/2798219-crude-futures-surge-20pc-top-111-bl
2. https://www.profilenews.com/en/oil-114-global-stock-market-decline/
3. https://www.federalreservehistory.org/essays/oil-shock-of-1973-74
4. https://www.chicagofed.org/publications/chicago-fed-letter/2021/464


AI Optimism Meets Market Reality

AI Optimism Meets Market Reality

  • Surging AI valuations and record spending raise the risk of a potential market bubble.
  • Elevated expectations leave little margin for error, especially for Americans near retirement.
  • Protecting your finances with physical gold in a Gold IRA can help reduce risk during market volatility.

AI Boom or AI Bubble?

Artificial intelligence has become the market’s dominant story. Trillions in projected spending, record stock valuations, and daily headlines about breakthroughs have fueled a powerful rally in major technology names.

But alongside the excitement, risk is rising. Capital expenditures are surging. Valuations are stretched. And even veteran tech leaders warn that “train wrecks” are inevitable along the way.

For investors, especially those nearing retirement, the question isn’t whether AI is transformative. It’s what happens if today’s expectations prove too optimistic.

History Rarely Rings a Bell at the Top

The late-1990s dot-com boom was powered by genuine innovation. The internet did change the world. But that didn’t prevent the Nasdaq from falling 78% between 2000 and 2002. A $100,000 tech-heavy portfolio lost more than $80,000 in that downturn. Gold, by contrast, rose roughly 25% during that same period.1

Bubbles rarely collapse because innovation fails. They unwind because expectations outpace reality.

The housing bubble followed a similar pattern. Warning signs were visible years before the crash. Risky lending was widely discussed. Markets continued rising anyway—until excess unwound.

Today’s AI cycle carries echoes of both.

Massive Spending, Lofty Expectations

Big Tech companies are planning roughly $650–700 billion in AI-related capital expenditures in 2026 alone. Global data center investment could reach $1.7 trillion by 2030.2

Meanwhile, Nvidia recently approached a $4.8 trillion market capitalization. That valuation implies the company could capture an estimated 15–30% of all U.S. corporate profits by 2036. To generate a modest 10% annual return from these levels, profits would need to rival the current share of the entire U.S. corporate sector.3

That is an extraordinary assumption.

Fund managers are taking notice. Roughly 35% now say AI overinvestment is the market’s top risk, the highest reading in two decades.4

At the broader level, the S&P 500 trades near 28 times earnings, well above long-term historical averages. Earnings yields imply real returns closer to 3.5% going forward, roughly half the long-term norm.

Optimism may still prove justified. But the margin for error is narrowing.

Early Cracks Beneath the Surface

Even within the AI ecosystem, volatility is increasing.

Shares of Adobe and Salesforce have fallen more than 40% from recent highs as AI code agents threaten traditional software subscription models. Block has cut roughly 4,000 jobs. The State Street software ETF has shed approximately $1.6 trillion in value.5

Economist Mark Zandi of Moody’s Analytics assigns roughly 25% odds to a recession if AI investment fails to generate expected returns.

Meanwhile, some analysts warn of a different risk: what if AI succeeds too quickly? Research firms such as Citrini Research have raised the possibility that rapid automation of white-collar roles could pressure employment and consumer demand—even if equity markets remain elevated.

AI Blog Chart

6

Markets do not need a clear catalyst to reverse. Excess alone can be enough.

Why This Matters More After 55

Younger investors have time to recover from major drawdowns. Near-retirees do not.

Data from Vanguard shows many self-directed investors over age 55 hold 70% or more of their portfolios in equities. After stocks returned roughly 17% last year compared to bonds’ 7%, many traditional 60/40 portfolios have drifted closer to 80/20 or beyond.7

That increases vulnerability to a sharp repricing in mega-cap technology stocks, which now represent an outsized share of major indexes.

A reversal in a handful of dominant names could translate into double-digit losses for passive investors almost immediately.

AI Optimism Meets Market Reality

Conclusion

AI may power a new era of innovation. It may also follow the historical pattern of boom, overreach, and correction. Massive spending, concentrated market leadership, and historically high valuations raise the stakes—particularly for those nearing retirement.

The question isn’t whether artificial intelligence will change the world. It’s whether your portfolio is positioned to withstand volatility if expectations change first.

Historically, tangible assets such as physical gold have served as a stabilizing force during periods of equity market stress. Unlike high-growth equities, gold carries no earnings assumptions, no capital expenditure requirements, and no counterparty risk.

Consider shielding the value of your portfolio with physical precious metals. A Gold IRA offers tax-advantaged long-term protection for your retirement funds. To learn more, call American Hartford Gold today at 800-462-0071.

Notes
1. https://www.investopedia.com/how-the-next-recession-may-look-like-the-2001-dotcom-bust-4584237
2. https://finance.yahoo.com/news/big-tech-set-to-spend-650-billion-in-2026-as-ai-investments-soar-163907630.html
3. https://capital.com/en-int/markets/shares/nvidia-corp-share-price/market-cap
4. https://www.businessinsider.com/ai-capex-overspending-bofa-fund-manager-survey-hartnett-2026-2
5. https://www.morningstar.com/news/marketwatch/20260113134/salesforce-and-adobe-see-their-stocks-slide-as-ai-fears-intensify
6. https://www.citriniresearch.com/p/2028gic
7. https://corporate.vanguard.com/content/corporatesite/us/en/corp/vemo/2026-outlook-economic-upside-stock-market-downside.html