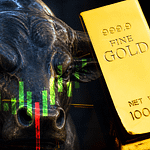


Famous hedge fund manager Jeffrey Gundlach is bullish on gold, saying it has “explosive potential energy” and is building a strong support base for higher prices.
Why? He’s bearish on U.S. Treasury bonds and sees inflation coming fast. This leaves him positive on gold and other commodities for the near future.
Speaking at a conference, Gundlach noted that non-yielding assets like gold and silver can do well during periods where real interest rates turn negative. If inflation rises above bond yields, that explosive energy could be released.
On Monday, Mitsubishi echoed these concerns in an investor report. “For gold there is potential upside from investors buying the metal as an inflation hedge.”
Standard Chartered’s Suki Cooper thinks gold prices could see gains after the Fed’s meeting in June, especially as the U.S. dollar is predicted to trend weaker in the second half of 2018. Any temporary added strength in the dollar short term will not be sustainable, she believes.
Line Futures president Bill Baruch also believes the landscape is very constructive for gold and expects higher prices.
READ NOW: FOUR CHARTS EVERY STOCK INVESTOR MUST SEE
The market serves up an avalanche of data every day. It is so much that it can be hard to see the forest for all the trees. That’s why many experts have favorite charts they consult to understand the broad direction of the market.
Now you can see them for yourself. The four charts below are best of class: the most influential faves from a survey that asked financial gurus about their most trusted charts that influence key investment decision-making.
Be forewarned… these charts are sobering reminders of the serious challenges facing investors today:
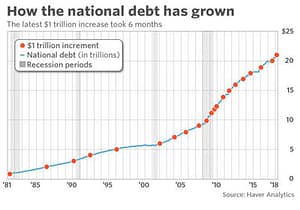
1) OUT OF CONTROL DEBT
Prescient market blogger Wolf Richter thinks debt – both government and student loans – is a critical concern for the markets.
The chart at right shows how the national debt has grown since 1981. In fact, it took only six months for U.S. national debt to go from $20 trillion in September 2017 to $21 trillion in March 2018.
This rapid rise in debt is unprecedented in history. The nation’s debt is now bigger than its gross domestic product and net interest payments (if rates continue to rise) could kill all economic growth.
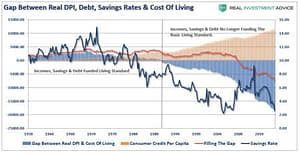
2) CONSUMER SPENDING TO HIT A WALL
Clarity Financial’s chief strategist Lance Roberts chose a chart that visualizes the ominous widening gap between the cost of living and the income/credit available to most Americans.
Up until the 1990s, disposable income, savings and debt funded the standard of living. Rogers warns that since the economy is 70% driven by consumption, the inability of consumers to continue to spend could “strangle any positive economic growth.”
According to CreditDonkey.com, 38 million households in the U.S. live hand to mouth, meaning they spend every penny of their paychecks.
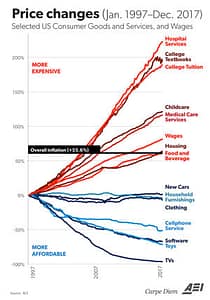
3) INFLATION RISING WHERE IT HURTS AMERICANS THE MOST
The next chart was created by Professor Mark Perry and recently refreshed by Ritholz Wealth Man
agement.
Overall inflation is up over 50% in the last 20 years, especially for basic goods and services, housing,hospital care and other necessities.
Only discretionary items like TVs, software and toys seem to be getting cheaper.
This is a real “pocketbook” issue that hurts real Americans everywhere.
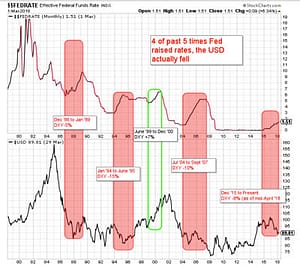
4) U.S. DOLLAR ON THE DECLINE
LPL Financial senior market strategist Ryan Detrick points out that rising rates have recently led to a weaker dollar.
This trend has held true for four out of the last five rising rate environments. A weaker dollar could well mean stronger gold prices.
With the current market forecasts saying that as many as two rate hikes could be ahead for 2018, this one bears paying attention to.
“This chart tells investors that it pays to dig a little deeper and not always follow conventional wisdom,” says Detrick
Wise words, indeed!
Massive debt, stagnant incomes and higher inflation are not just on the horizon… they are already here for American investors. The dollar is clearly under heavy downward pressure long term despite higher interest rates.
No one knows what will trigger the next financial meltdown, but everyone needs to consider owning an asset that provides you with liquidity, privacy and can act as a hedge in uncertain times: gold.
SELL IN MAY AND GO AWAY?
According to the Stock Traders Almanac, the time between the start of May and end of October tends to be seasonally weak time for the markets, giving way to the phrase “sell in May and go away.”
Goldman Sachs says uncertainty in the markets is here to stay and the upcoming midterm elections are one reason to expect current elevated levels of uncertainty to be the norm.
Inflation has risen and the sizzling global economy has caused commodities to become the new focus for many investors. While the Korean talks are promising, the U.S. has serious challenges ahead with Russia’s aggressiveness and China’s willingness to fight back in any trade war. Political gridlock in Washington, D.C. is a permanent fixture and the upcoming midterm elections in November promise more even domestic discord.
The charts above are a wake-up for you to understand the serious structural issues facing the market. It is time to get ahead of the tough times to come.
Now is the time to consider owning physical gold and silver before the next crisis hits.