





SPEAK WITH A SPECIALIST
800-462-0071

I WANT TO

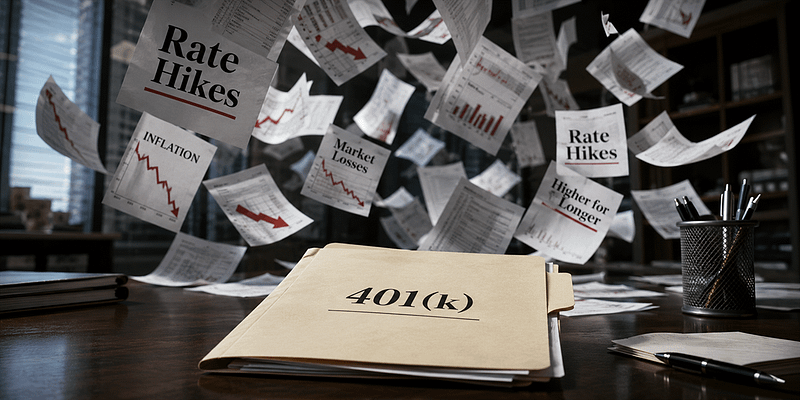
The Dollar You’re Holding Isn’t Worth What You Think

  • The dollar has lost nearly 30% of its purchasing power since 2020.
  • Money supply growth and changing inflation calculations may hide the full extent of the dollar’s decline.
  • Physical gold can help protect your finances from inflation and preserve long-term purchasing power.

A Silent Tax

The value of the dollar is easy to overlook because the number printed on it never changes. A $100 bill is still a $100 bill. What changes is how much it can buy.

Since January 2020, the dollar has lost nearly 30% of its purchasing power. What cost $77 then costs about $100 today. The decline happened without a vote or a new law. Gradually rising prices reduced the real value of every dollar held in a bank account, retirement fund, or emergency reserve. 1

A family that got by on $50,000 a year in 2020 needs roughly $65,000 now just to stand still. Families are left to close that $15,000 gap on their own. Data shows they are pulling from savings, taking on debt, or accepting a lower standard of living. Wages may have risen for many people over the same stretch. But a raise that doesn’t outrun a 29% jump in prices functions as a pay cut underneath the surface.

As confidence in the dollar’s long-term purchasing power weakens, more Americans are turning to physical gold and silver. Unlike paper currency, precious metals cannot be created at will and have historically helped preserve purchasing power during periods of inflation and currency decline.

How the Money Got Diluted

An unprecedented monetary policy is behind the dollar’s erosion. The M2 money supply is a measure of the total amount of cash and other readily available money circulating in the economy. It was expanded by more than $6 trillion during the pandemic era. Its growth was unmatched in modern history for its speed and scale. 2

Every dollar already in circulation got a less valuable as trillions of new ones were created. Like adding water to a drink, the volume increases but strength is diluted. Inflation followed as the economy reopened, supply chains struggled, and consumer demand surged. By 2022, it spiked over 9%, the highest reading in four decades.

The pain hasn’t landed evenly. Miami has seen a cumulative dollar decline of 33.6%. San Diego has seen 32.8%. Cities already burdened by high housing costs are now facing an additional squeeze as inflation further erodes the value of every dollar.3

The Official Number May Be the Rosy Version

Even the widely cited 29% figure may understate what’s really happened. Economist John Williams argues that official inflation figures understate the true loss of purchasing power. CPI calculations changed during the 1980s and 1990s. The revised methodology included substitution effects and other adjustments that can reduce the reported inflation rate. Using the earlier method, Williams estimates the dollar has lost closer to 50% of its purchasing power since 2020. Substitution methodology assumes a shopper will swap steak for ground beef when prices climb, then counts that forced downgrade as though no harm occurred.5

A similar story is unfolding right now. The Bureau of Economic Analysis is overhauling how it calculates the PCE price index, the Fed’s preferred inflation gauge. The new approach is taking effect in September and applying retroactively to 2021. Economists at Goldman Sachs and Wells Fargo expect the revision to trim recent core PCE readings by roughly 0.2 percentage points. A shift produced entirely by the new calculation rather than any actual change in prices.6

The Fed Isn’t in a Hurry to Rescue Anyone

June’s Consumer Price Index report showed inflation cooling from 4.2% to 3.5%. It was welcome news after months of pressure from geopolitical tension and rising energy costs. Fed chair Kevin Warsh remains unmoved. He told the House Financial Services Committee that the improvement is just “one data point”. He wants considerably more evidence before treating inflation as under control.7

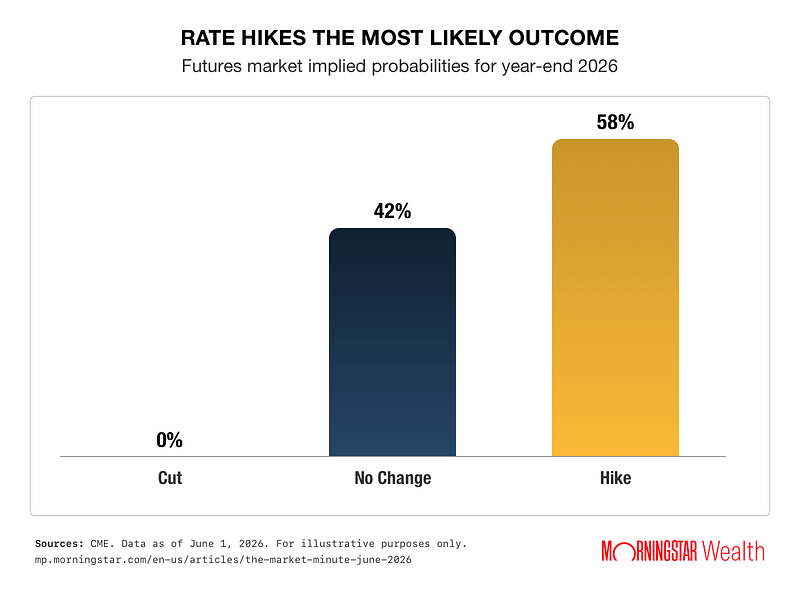
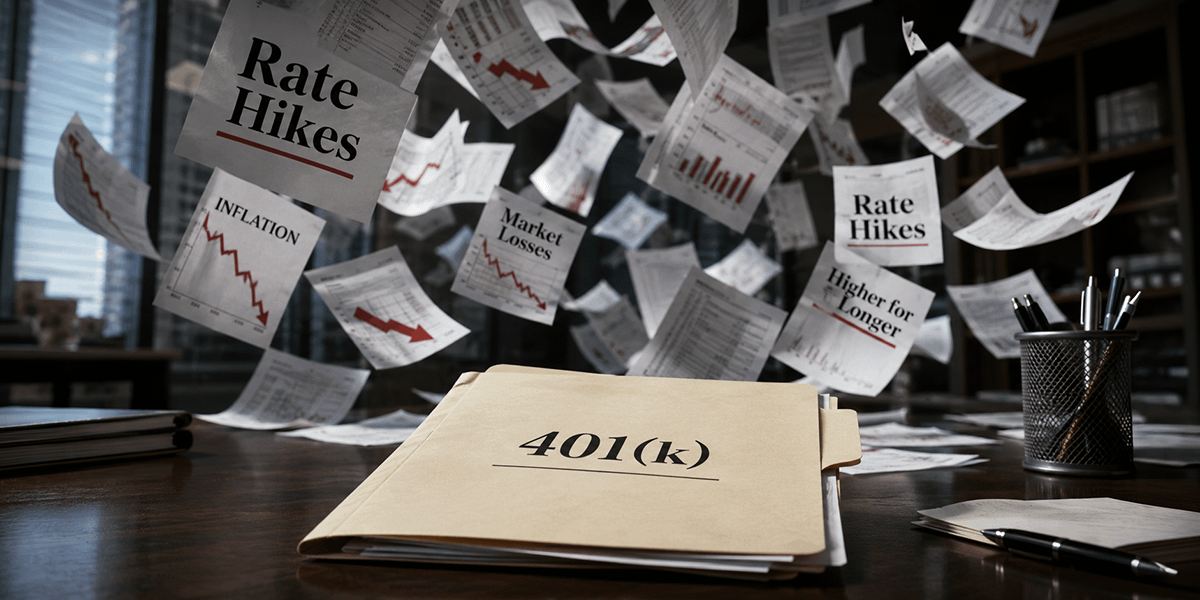
Markets shouldn’t expect relief soon. At the June 17 FOMC meeting, nine of the 18 Fed officials projected at least one rate hike before the end of 2026. Six of them projecting two. The committee held rates steady. But the median projection now shows the federal funds rate ending the year higher than where it started, a sharp reversal from the Fed’s own forecast just three months earlier.8

Conclusion

Despite the most recent dip in inflation, the dollar’s decline in purchasing power continues with no clear end in sight. The currency has lost close to a third of its value in six years. The true loss may be even larger than reported. The agency in charge of measuring inflation is changing its own methodology that can make the damage look smaller without prices actually falling. Meanwhile. the people setting monetary policy admit they aren’t confident the problem is solved.

Physical gold has spent centuries holding value independent of any single government’s money supply decisions or any statistical agency’s methodology. It cannot be diluted by a printing press. And it does not get revised retroactively by a committee. If you want to learn more about protecting the value of your portfolio with physical precious metals in a Gold IRA, contact AHG today at 800-462-0071.

Notes
1. New American
2. Wealth MD
3. In 2013 Dollars
4. Visual Capitalist
5. New American
6. FX Street
7. CNN
8. CNBC

Private Credit Is Flashing 2008 Warning Signs


  • Private credit carries hidden leverage, unclear valuations, and liquidity risks similar to those seen before the 2008 crisis. 
  • Rising losses and withdrawal limits suggest stress may already be building beneath the surface.
  • Precious metals in a Gold IRA can help protect your finances since they are independent of the traditional credit system.

Private Credit Risks Are Building

A story is unfolding in the private credit market that most Americans have never heard of, and that’s a problem. While headlines chase the stock market’s daily swings, a $3.5 trillion lending industry has quietly built up many of the same structural weaknesses that made the 2008 financial crisis so devastating. With the risk of a systemic crisis building, more people are considering safe-haven assets that are independent of the traditional financial system.

What Private Credit Actually Is

Private credit is direct lending by non-bank funds to companies that skip traditional banks and public markets. Stricter rules after 2008 made banks less willing to hold this kind of risk. Private equity firms like Blackstone and Apollo stepped into the gap, raising massive pools of investor money to lend to mid-sized companies. The pitch centered on steady income and attractive yields. For years, funds grew fast enough to pay departing investors with new investor cash, without ever selling a loan to raise money.

2008 Comparisons

The 2008 financial crisis became dangerous when hidden debt, unclear risks, and fragile funding systems all broke down at once. Private credit is showing similar warning signs, including hard-to-sell loans, valuations set by fund managers instead of public markets, and limited transparency about where the greatest risks may be hiding.

The Stress Is Already Showing Up

An analysis of 53 publicly traded business development companies, or BDCs, found that 28 lost money in the first quarter of 2026. Only 12 reported losses a year earlier, while 10 did so in 2024.

The group moved from an average profit of $26 million in the first quarter of 2025 to an average loss of $7.6 million one year later. Loan markdowns were a major factor, with software borrowers disrupted by artificial intelligence creating particular concern.

Several major funds have also reported significant losses. Blue Owl’s OTF fund recorded its largest markdown since launch. FS KKR posted its second-largest realized loss, while Crescent Capital BDC reported its highest quarterly losses since 2020.2

Leverage Hiding in Plain Sight

Part of what makes this risk hard to see is how it’s being financed. Average borrowing costs at listed BDCs has climbed roughly 20% over the past two years. At the same time, funds are relying more heavily on payment-in-kind financing, known as PIK. With PIK, borrowers pay interest by adding it to existing debt instead of cash. PIK income represented 8.1% of BDC interest and dividend income in 2025, about twice its pre-2020 level. PIK can make reported income appear stronger without producing cash. Industry professionals describe rising PIK income as a possible sign of weakening credit quality.3

Add to that a growing reliance on off-balance-sheet borrowing. These joint ventures and special-purpose vehicles don’t appear in standard leverage calculations. Among the few funds that disclosed complete data, total borrowing jumped 80% in a single year once these hidden structures were added back in. 4

Withdrawal Limits Reveal the Liquidity Problem

BlackRock’s $26 billion HPS Corporate Lending Fund offers a clear example. During the first quarter of 2026, fund holders requested withdrawals equal to 9.3% of shares. BlackRock limited withdrawals to the fund’s 5% quarterly cap. Requests climbed to roughly 13% during the second quarter, and the fund imposed the limit again.5

The private credit liquidity mismatch is playing out in real time. These funds were marketed to retail investors with the promise of periodic access to cash. But the underlying loans can’t be sold quickly without taking a loss. So, when enough investors want out at once, the fund simply refuses.

In a sign that private credit managers may be bracing for trouble, lending volume has fallen more than 50% even as fundraising has jumped more than tenfold.

Regulators Are Worried

European regulators are pressing U.S. officials for information about private credit funds. They are openly worrying about hidden risks that could spread through banks, insurers, and pension funds. If regulators cannot see where the money and risk are hiding, individual investors have little chance of knowing either.

Conclusion

Before the 2008 financial crisis, everything appeared stable. In hindsight, the warning signs were everywhere: hidden leverage, complicated financing, and institutions tied together by risks few people understood. Once the cracks appeared, the damage spread quickly and nearly brought down the entire financial system.

Private credit shows the same warning signs today. No one can predict whether private credit will trigger another crisis, but history shows the danger of waiting until the problems become impossible to ignore. Especially now that there is a push to allow retirement funds to invest in private credit companies.

Physical gold offers a way to hold value outside the credit system. Its value does not depend on a borrower, fund manager, or Wall Street institution.

Learn how to protect your savings with a Gold IRA by calling American Hartford Gold today at 800-462-0071.

Notes
1. Statista
2. Reuters
3. Reuters
4. Reuters
5. Bloomberg

Beyond the AI Bubble: How AI Could Disrupt Your Retirement

  • AI’s economic risks extend beyond a possible stock bubble to jobs, prices, Social Security, and retirement portfolios. 
  • AI-driven disruptions are already emerging, while promised productivity gains and public benefits remain uncertain. 
  • Physical gold in a Gold IRA may help protect your finances from AI-driven inflation, job losses, and market volatility. 

AI’s Economic Risks Are Here

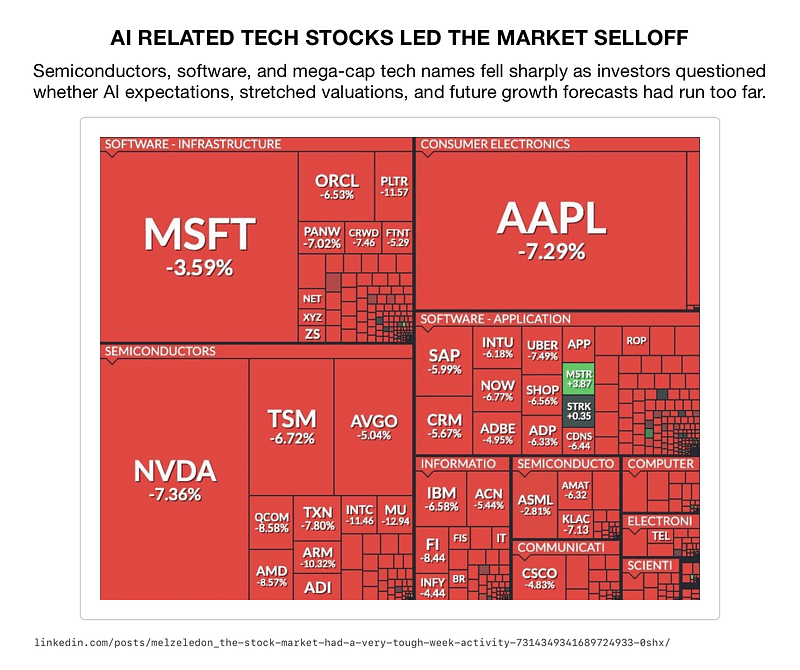
Much of the debate around artificial intelligence has focused on whether AI stocks are in a bubble. For retirees and those approaching retirement, a more important issue may be how quickly AI is changing the economy beneath their portfolios. The financial pressures created by AI are already being felt. Many of its promised benefits may arrive too late for some retirees, making it important to take steps now to help protect their nest egg. 

AI Is Already Reshaping the Job Market

AI-related layoffs are beginning well before the technology has proven it can fully replace the workers being cut. A Harvard Business Review executive survey analysis found that many companies are reducing staff and slowing hiring based largely on AI’s expected future impact. Generative AI has yet to produce the productivity gains many businesses are counting on.1

Technology companies accounted for nearly one-third of all U.S. layoffs during the first half of 2026, with AI increasingly cited as a reason for the cuts. Goldman Sachs economist Joseph Briggs estimates that more than 9% of the labor force, or roughly 15 million workers, could lose their jobs during a decade-long transition to AI.2

AI-driven job losses could create risks well beyond the workers directly affected. Fewer jobs and lower wages could weaken the payroll tax base that funds Social Security and place added strain on pension systems. 

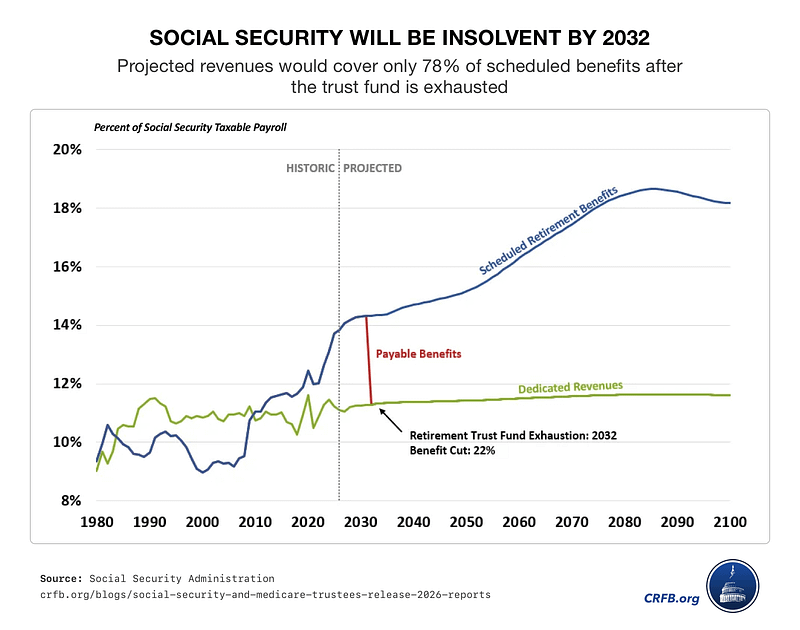
Social Security already faces a projected shortfall within the next decade. A prolonged decline in employment could reduce the money flowing into the system while pushing more people to claim benefits earlier than planned.  

Higher unemployment may also weaken consumer spending and corporate profits. Adding pressure on the stocks and bonds inside many retirement accounts. Most portfolios are designed to withstand normal market downturns. But a lasting shift in how Americans earn a living could create a much deeper challenge. 

AI Is Adding to Price Pressures

Americans are already dealing with persistent inflation. The rapid expansion of AI could place even more pressure on prices before its promised productivity gains arrive. 

More than 80% of economists surveyed by the National Association for Business Economics expect the current AI buildout to be inflationary over the next year. Data centers are competing with other industries for chips, copper, electrical equipment, and large amounts of power.4
Alphabet, Amazon, Meta, and Microsoft alone plan to spend roughly $720 billion on data centers this year. JPMorgan Chase economists also estimate that the price of some computer memory chips could rise by as much as 400% between 2024 and the end of 2026.5

Consumers are already seeing higher costs for laptops and electricity. Economists expect those pressures to continue through at least the end of the year. 

AI could eventually improve productivity and help ease some price pressures. However, portfolios must withstand today’s inflation and market volatility while those longer-term benefits remain uncertain. 

Some elected officials are pushing proposals that would require major AI companies to share a portion of their financial gains with the public. Supporters argue that Americans should receive some compensation for the job losses and economic disruption the technology may create.6

The debate remains unresolved, and any meaningful changes could take years. The public may or may not receive a mandated share of the AI boom, but no such benefit exists today. Those near or at retirement cannot rely on one arriving in the future. 

Gold as a Hedge Against What Comes Next

Physical gold has long served as a store of value that moves independently of stock valuations, corporate earnings, and Federal Reserve policy. It doesn’t get displaced by automation. And its worth doesn’t depend on any single company’s AI bet paying off. A Gold IRA lets retirement savers hold physical bullion inside a tax-advantaged account, adding a layer of diversification that isn’t tied to the outcome of the AI trade. 

Conclusions

Past economic revolutions unfolded over decades or even generations. The AI revolution could reshape jobs, prices, businesses, and financial markets within just a few years. The speed and scale of the change have become serious enough that more than 200 economists, researchers, and technology leaders signed an open letter calling for immediate action. They are warning that AI could produce an economic transformation larger than the Industrial Revolution in a fraction of the time.7

No one knows what the economy will look like when the transition is complete. For those near or at retirement, waiting for certainty could mean leaving a lifetime of savings exposed during the most disruptive years. Diversifying now may help protect the financial foundation you have spent decades building. To learn more about how a Gold IRA can help you, contact American Hartford Gold today at 800-462-0071.

Notes
1. Hardvard Business Review
2. Ace IT
3. Hardvard Business Review
4. MarketPlace.org
5. Statista
6. Sanders Senate
7. 10TV

Paper Silver Falls, Physical Silver Holds Strong


  • Silver’s sharp pullback was driven largely by paper trading, margin pressure, and short-term momentum. 
  • Silver prices are predicted to rise as physical demand remains strong and supply remains tight. 
  • Physical silver can help protect your finances from inflation, market volatility, and dollar weakness. 

Silver’s Paper-Physical Divide

After reaching record highs earlier this year, silver fell sharply from its January peak, dropping roughly 50% to around $60 an ounce. For anyone who watched the metal soar to historic highs only months ago, the reversal has been jarring.  But the deeper picture reveals a more encouraging outlook.1

Much of the recent weakness has been concentrated in the paper silver market. Exchange-traded products, margin pressure, and short-term trading can create sharp swings. Physical silver, however, continues to show signs of strength. Industrial demand remains firm as supply remains tight. Analysts still see the potential for higher silver prices if fundamentals regain control of the market. 

The Paper Market Shook Silver

Silver’s early-year surge was fast and intense. Some analysts saw the final move higher as more speculative driven rather than fundamentally driven. Paul Mladjenovic, author of Investing in Gold and Silver for Dummies, called the move a “mania” that pushed prices too far, too fast.  

Several forces helped fuel the spike and then unwind it. India allowed pensions to invest in precious metals. The move unlocked about $1.7 billion of potential precious-metals demand.2 In addition, China designated silver a strategic asset. They began restricting its exports, limiting global supply. As rates and the dollar firmed, margin requirements tightened and short-term traders began heading for the exits. 

Selling then fed on itself. Traders weren’t seeking long term ownership of the metal. They sought profit on contracts tied to silver’s price. Many were simply riding momentum. Then that momentum reversed. And the same paper-market forces that helped push silver higher began pulling it lower. None of that trading activity required anyone to hold an ounce of actual metal. 

For retirees and savers, the distinction matters. A paper price can fall because of short-term trading pressure. Physical silver can remain in demand because businesses and governments can’t do without it.  

Physical Demand Remains Strong

Silver holds a unique role as both a precious and industrial metal. 

Demand continues to come from electronics, solar energy, and AI data centers. Silver’s unique properties make it difficult to replace in tech applications. It is no longer just a commodity to trade. Governments are increasingly treating silver as a strategic “critical material”.3

That creates a clear divide. Traders are focused on Fed signals, the dollar, margin pressure, and technical charts. Physical users are focused on availability, reliability, and long-term need. 

Futures markets may be pricing silver like a cyclical commodity, even as physical supply tightens beneath the surface. Over time, that gap between paper price and real-world scarcity could become harder to ignore. 

Supply Deficits Add Pressure

Silver supply is not easy to increase quickly. Much of the world’s silver is produced as a byproduct of mining for other metals. Miners cannot always respond to rising silver demand by simply producing more silver. 

The Silver Institute projects that 2026 could mark a sixth consecutive year of supply deficit. Estimates foresee a shortfall of roughly 46.3 million troy ounces.5

Persistent deficits matter because physical markets eventually balance real supply with real demand. Paper trading can move prices in the short run. Physical shortages can reshape prices over time.

Analysts Still See Upside

Despite silver’s recent drop, several forecasts remain bullish. 

J.P. Morgan has projected an $81 average silver price for 2026, driven primarily by industrial demand growth. Mladjenovic has said silver may need to build a base around $58 to $62 before potentially moving toward $80 by year-end and $110 to $130 next year. Investing Haven’s long range forecast is eyeing $140 by 2030.6

None of those forecasts are guaranteed. Fed policy, the dollar, margin requirements, ETF flows, and futures positioning can all create sharp moves. Silver could face more turbulence before any bullish scenario plays out. 

If the paper market finishes shaking out weaker hands, silver may be positioned for renewed strength. The price action may look weak today, but the supply-and-demand picture still points to a more durable story. 

Conclusion

Silver’s recent decline may be less a rejection of the metal and more a reset after an overheated rally. Speculative pressure pushed prices too far, too fast. The correction removed some of that excess while physical demand remains.  

Based on forecasts, the recent weakness may give savers a chance to add silver before physical demand has a greater impact on prices. 

If you want to protect your portfolio with physical silver in a Precious Metals IRA, contact AHG today at 800-462-0071. 

Notes
1. Moomoo
2. Bloomberg
3. Mining Visuals
4. Babypips
5. Kitco
6. Axi

China’s Rising Bond Market Accelerates De-Dollarization

  • Panda bonds allow foreign borrowers to raise money in yuan instead of dollars. 
  • Brazil’s planned record panda bond sale is another sign of incremental de-dollarization. 
  • Physical gold can help protect your finances as de-dollarization threatens the dollar’s purchasing power. 

China’s Dollar Challenge Grows

Brazil is preparing to sell $735 million in yuan-denominated bonds inside China’s own domestic market. The deal would mark the largest first-time sovereign panda bond sale on record. Brazil ranks as one of the world’s largest economies, a G20 member and a major BRICS power.1

When an economy as large as Brazil starts borrowing in yuan, the message gets louder: the dollar’s grip on global finance is starting to crack.  

What Panda Bonds Actually Are

Panda bonds are yuan-denominated debt sold by foreign governments, banks, and corporations inside China’s own bond market. Foreign issuers borrow directly in yuan rather than dollars, often at rates far below what they could get at home. Pakistan recently issued yuan bonds at 2.5% interest, compared to an 11.5% benchmark domestically. 

The numbers show how fast this market is growing. Issuance hit roughly 133 billion yuan by late May of this year, nearly double the pace from the same period last year. Foreign issuers now account for 41% of the market, up from just 27% in 2023. Sovereign borrowers keep lining up: Pakistan, Kazakhstan, Slovenia, the UAE, and now Brazil.2

Why This Speeds Up De-Dollarization

Every new sovereign that borrows in yuan adds legitimacy to the currency as a global funding tool. The New Development Bank, the multilateral lender founded by BRICS nations, has openly pitched China’s onshore bond market as one of the cheapest sources of financing anywhere in the world.  

According to the bank’s director of treasury, Zhongxia Jin, the yuan is becoming not just an alternative to the dollar, but a “key pillar of the global financial architecture.”4

The bank also pushed maturities out to 10 years for the first time. Short-term borrowing can be temporary. A 10-year structure shows a durable commitment. 

Countries that borrow in yuan reduce their exposure to US interest rate policy. They also step outside the reach of dollar-based sanctions. For nations aligned with China or BRICS, that independence carries real strategic value alongside the cost savings. 

The scale remains modest compared to the multi-trillion-dollar dollar system. Still, the direction of travel matters more than the current size. Every additional issuer normalizes a world where the dollar is one option among several major reserve currencies.  

What It Means for the US Economy and Retirees

The United States has long enjoyed what economists call an exorbitant privilege: the ability to borrow cheaply because the rest of the world wants dollars. Foreign governments buying Treasuries has helped keep US interest rates lower than they would otherwise be. 

As more global savings flow into yuan-denominated assets instead of Treasuries, that advantage begins to erode. Reduced foreign demand for US debt can put upward pressure on interest rates and inflation over time. A weaker dollar buys less abroad and can push up the cost of imported goods at home. 

Retirees carry a disproportionate share of this risk. Fixed incomes do not stretch as far when inflation rises. Bond-heavy portfolios lose value in real terms when the currency backing them weakens. Savings built up over decades can quietly lose purchasing power even while the account balance stays the same on paper. 

A Slow Shift with Real Consequences

De-dollarization is not a single event. It builds through years of small decisions, like Brazil’s bond sale or Pakistan’s cheaper borrowing terms. Each one chips away at the assumption that the dollar will always be the default currency of global finance. 

Uncertainty about the dollar’s long-term value is not an abstract policy debate. It is a direct threat to how far a retirement account will stretch ten or twenty years from now. Currency risk rarely announces itself loudly. It shows up gradually, in higher prices and a shrinking real value of savings. 

Conclusion

Physical gold has served as a store of value for thousands of years precisely because it sits outside any single government’s monetary policy. It cannot be printed, devalued by a central bank, or defaulted on the way currency-denominated debt can be. As the dollar’s global dominance faces new pressure from trends like the rise of panda bonds, gold offers a way to hold wealth that does not depend on any one nation’s fiscal choices. 

Retirees have used gold to anchor a portion of their savings against currency depreciation and inflation. A Gold IRA allows that protection to sit inside a tax-advantaged retirement account, combining the stability of physical precious metals with the structure of traditional retirement planning. 

If you want to protect your portfolio with physical precious metals in a Gold IRA, contact AHG today at 800-462-0071. 
Notes
1. Reuters
2. AJU Press
3. Bloomberg
4. Deliver 2